
Snapshot
$9one-time
Up to 3 competitorsProduct — DigitAI Radar
Where does your product stand in the market? DigitAI Radar combines competitors, prices and capabilities with deeper research. Depending on the agreed scope, we include accessible customer opinions, community discussions and market sources.
Watch the film · 0:53
Selected data from the actual Radar analysis of 2 October 2026. This preview does not start new research.

8 comparison candidates · 117 supported claims
Select a cell to see the evidence behind its assessment.
↔ Swipe sideways to see all providers.
| Capability | DigitAI RadarOur product | Spyglass | Embase | Visualping |
|---|---|---|---|---|
| Compare capabilities and pricing | ||||
| Sources with quote and claim checks | ||||
| Automatic ongoing monitoring | ||||
| Native Mac app |
“Not evidenced” means the sources are inconclusive, not that a feature is absent. Providers are comparison candidates.
A claim is only as useful as its evidence. Open an example.
Scope and billing terms belong in the comparison. Every price links to its recorded source.
one-time
Up to 3 competitorsper month, billed annually
Up to 3 competitorsbilled monthly
Page monitoringAs of 2 October 2026, USD. Selected plans have different scopes and are not equivalent offers. Check current terms with each provider.
Compare capabilities, identify evidenced differences and keep unresolved questions visible. Turn an observation into a reasoned proposal for your roadmap.
Explore capabilitiesOpen the source behind a comparison. Explain pricing and scope without turning an inconclusive statement into a promise.
Explore evidenceReview individual products and product groups separately. See each product’s analysis date, source coverage and the next questions to discuss with your team.
See the actual portfolio117 of 143 reviewed claims are supported by sources. Select a part of the analysis.
The original quote was found in the collected page and assessed as supporting the claim. Only competitor facts passing these checks enter the synthesis.
The evidence rate measures source coverage. It does not rate product quality or development progress.
A single product or a whole product group: you choose the scope and deliberately start an analysis. Saved results remain available for comparison.
Select the product or group you want Radar to investigate.
Radar collects public sources, extracts statements and checks that quotes appear in the source and support the statements.
Review the results and changes, then accept the new record. Unchanged sources can retain their previously verified facts.
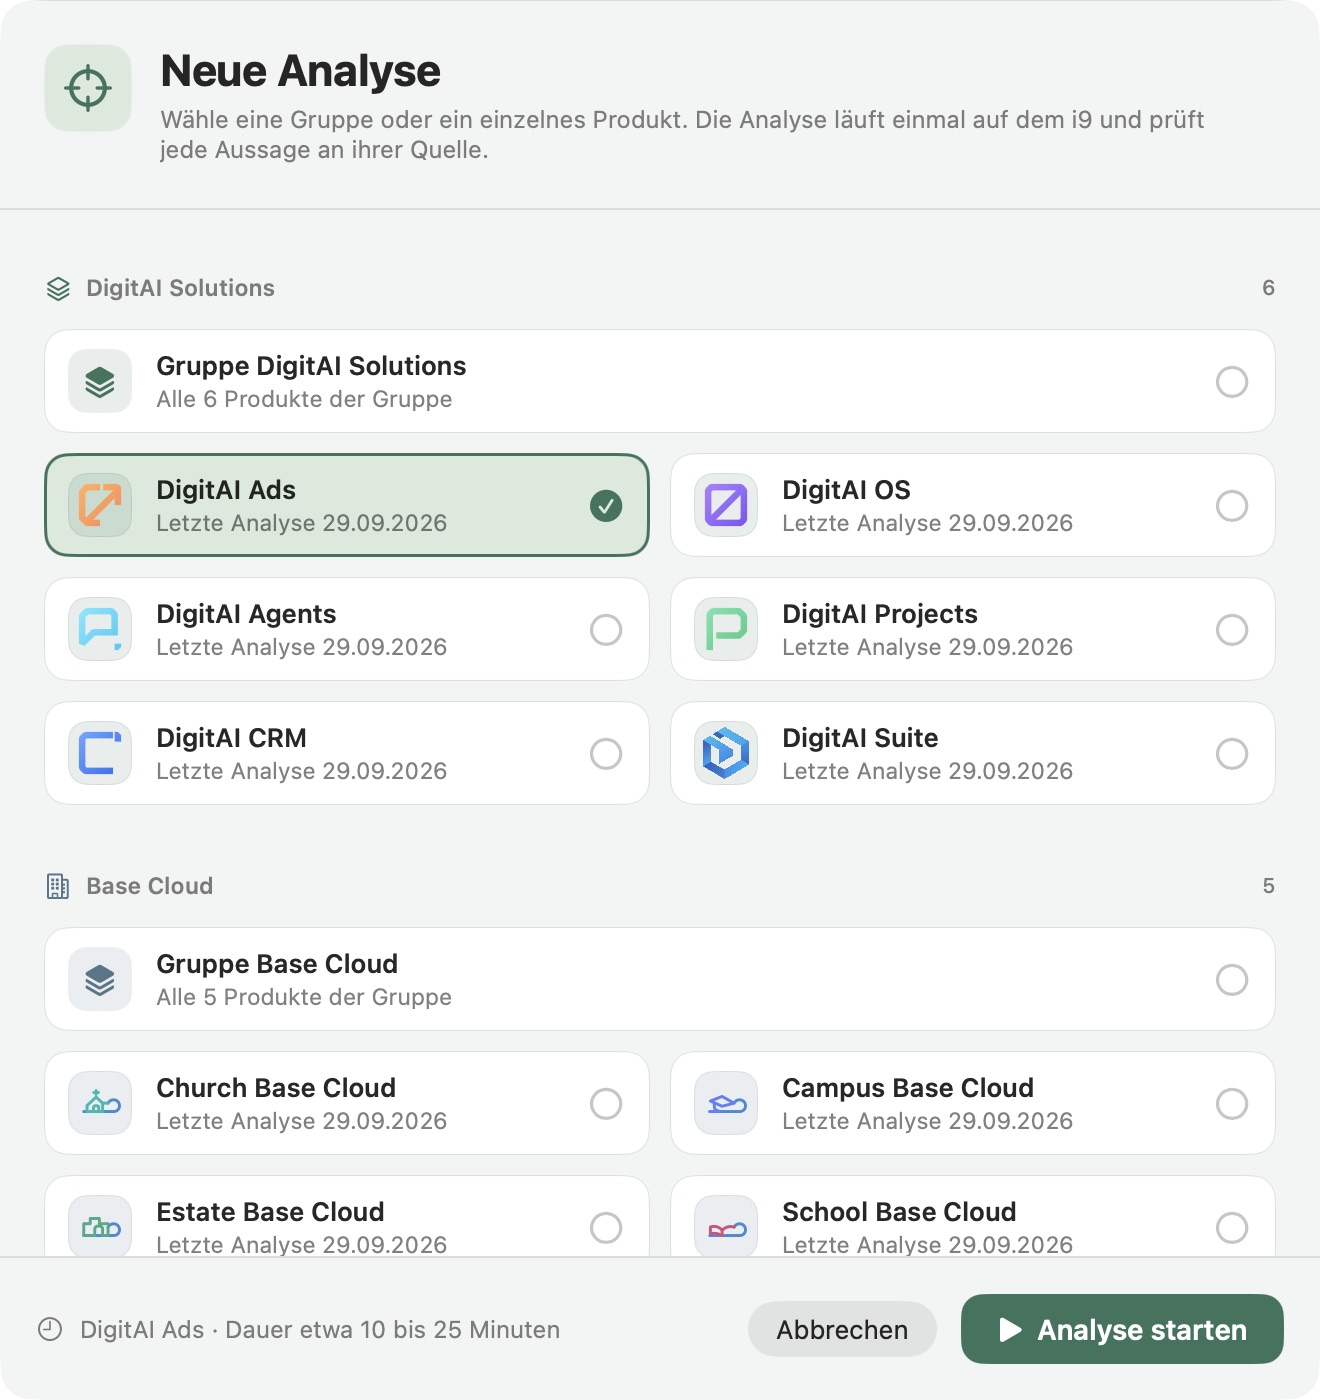
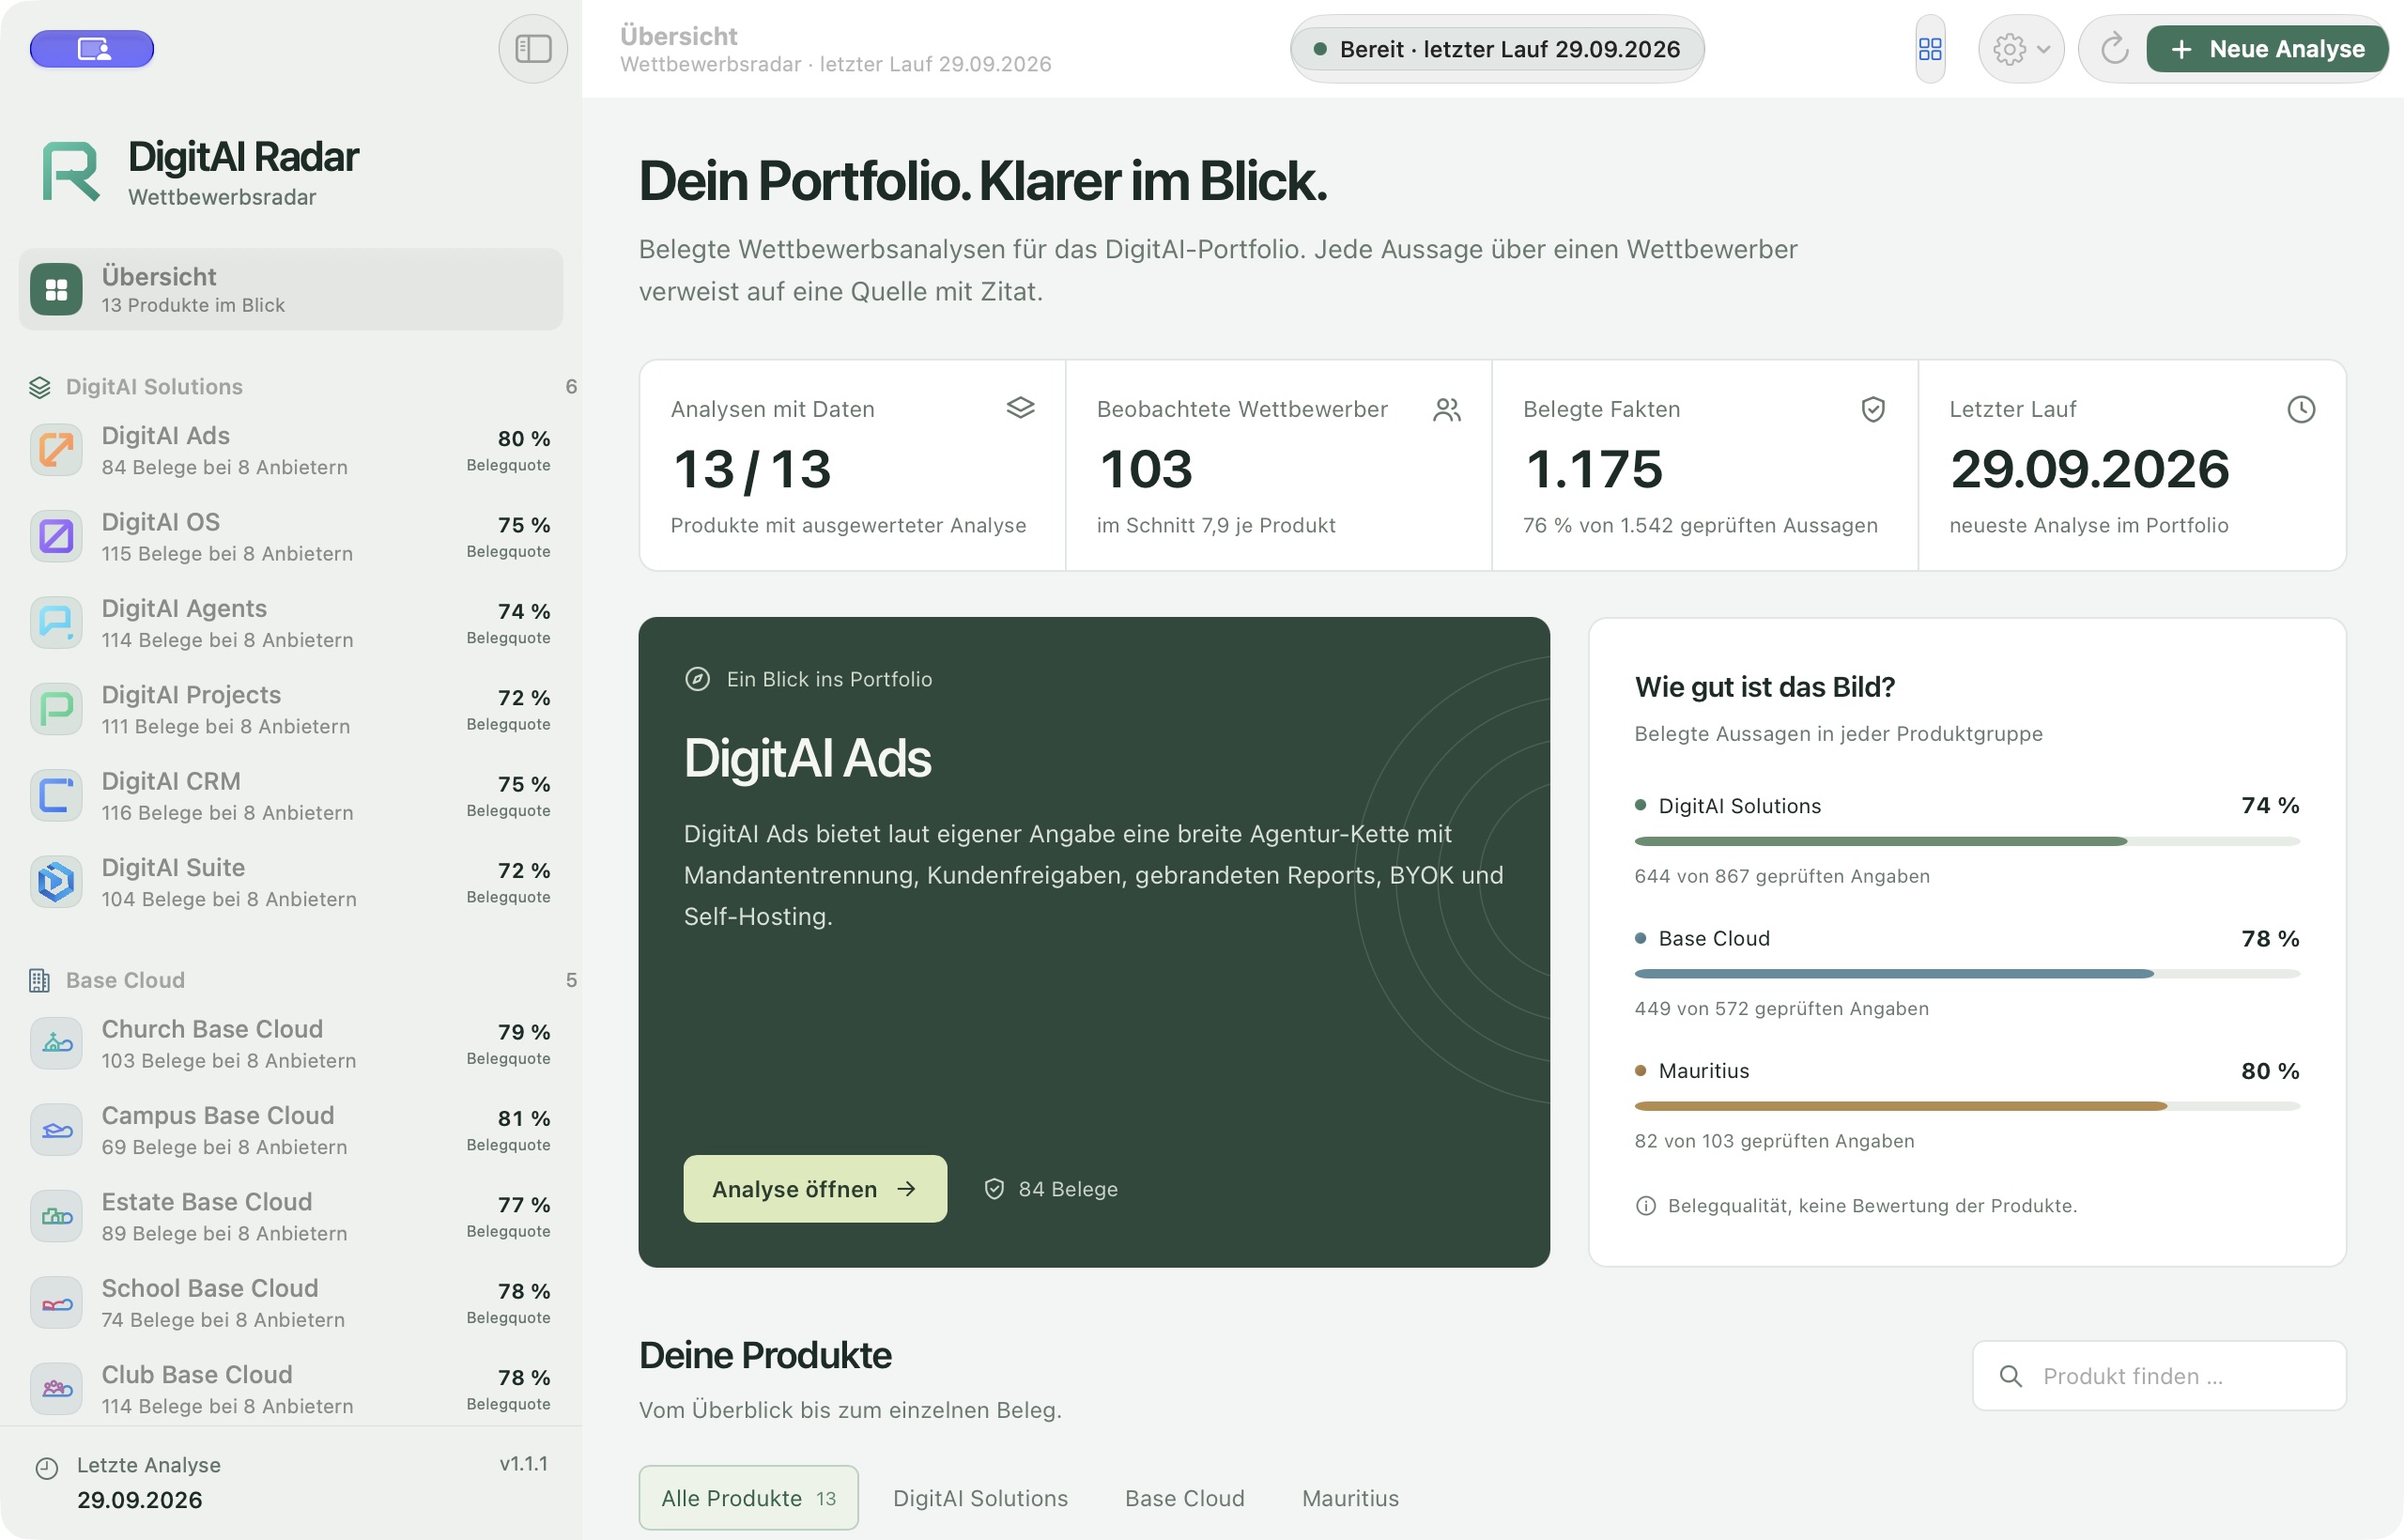
The preview above shows a selection. These original captures from the installed Mac app show the portfolio, positioning, capability comparison and evidence.
Radar keeps each analysis with the product it belongs to. Switch between groups and individual products, check the latest record and see how well sources support the statements. Shown here is our own portfolio: DigitAI Solutions, Base Cloud and our products in Mauritius.
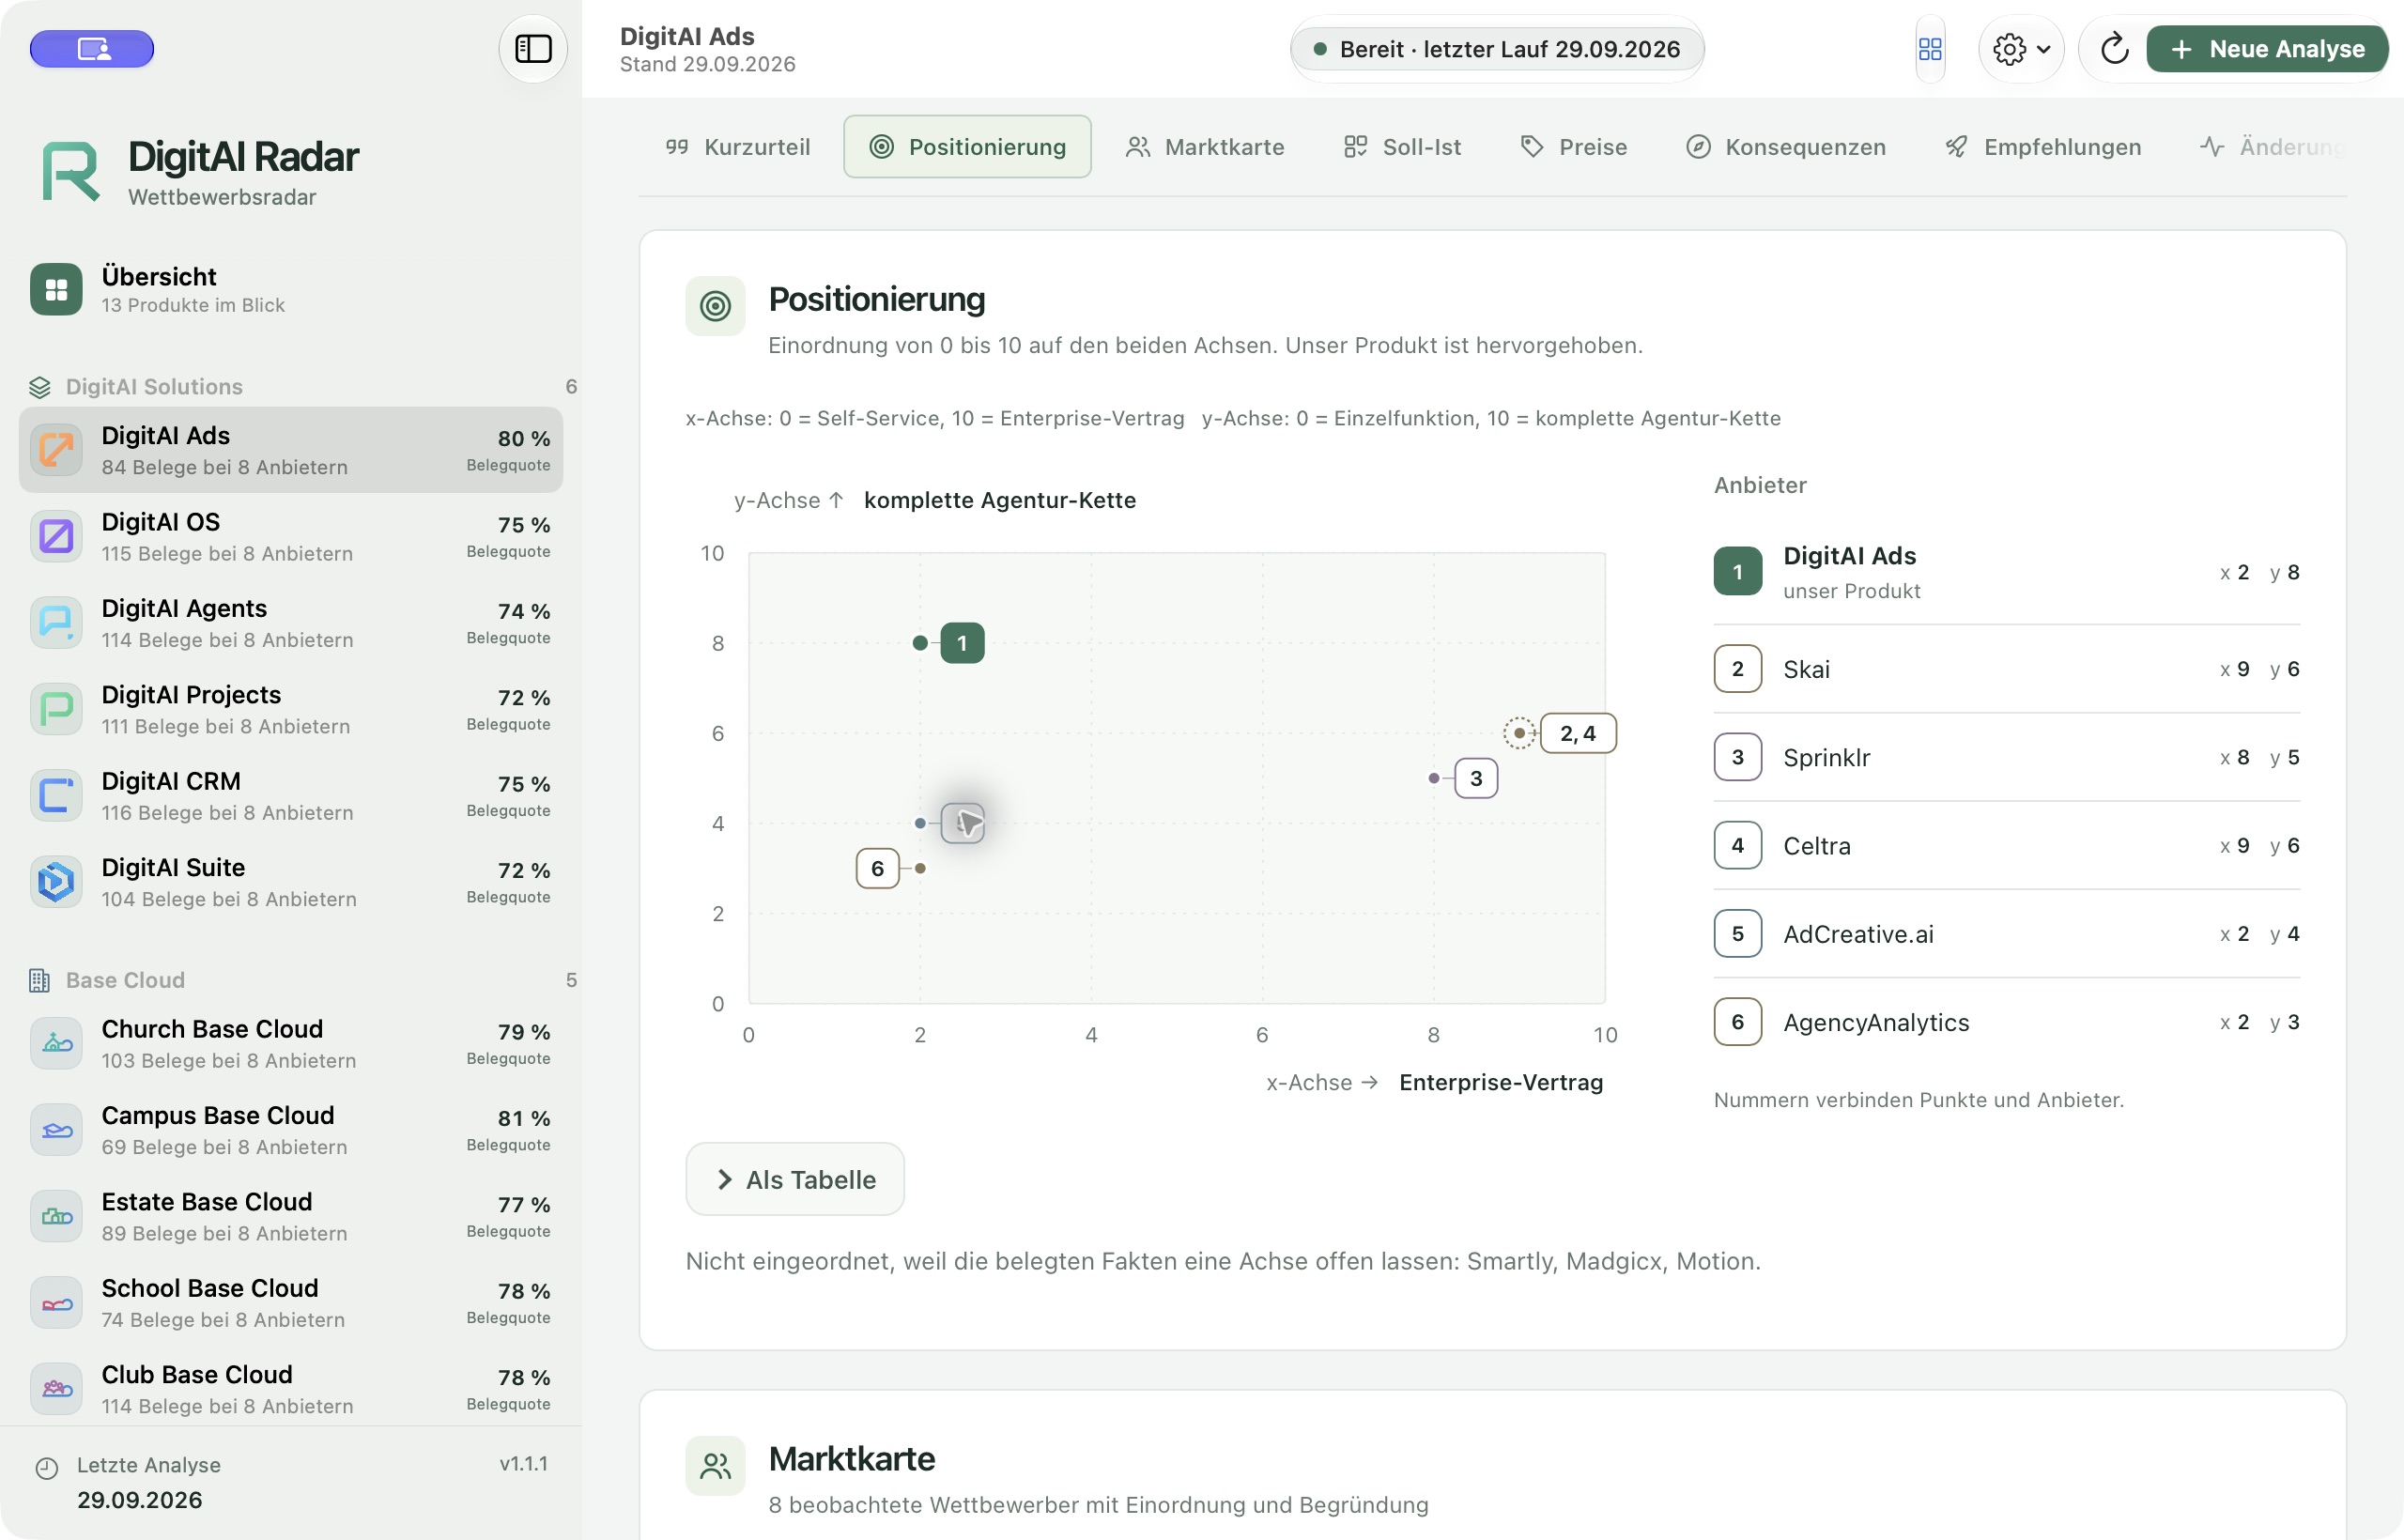
Your product and its competitors are positioned on two axes chosen for this market. A legend links each point to its provider. When evidence is insufficient for a placement, the provider is explicitly left unpositioned.
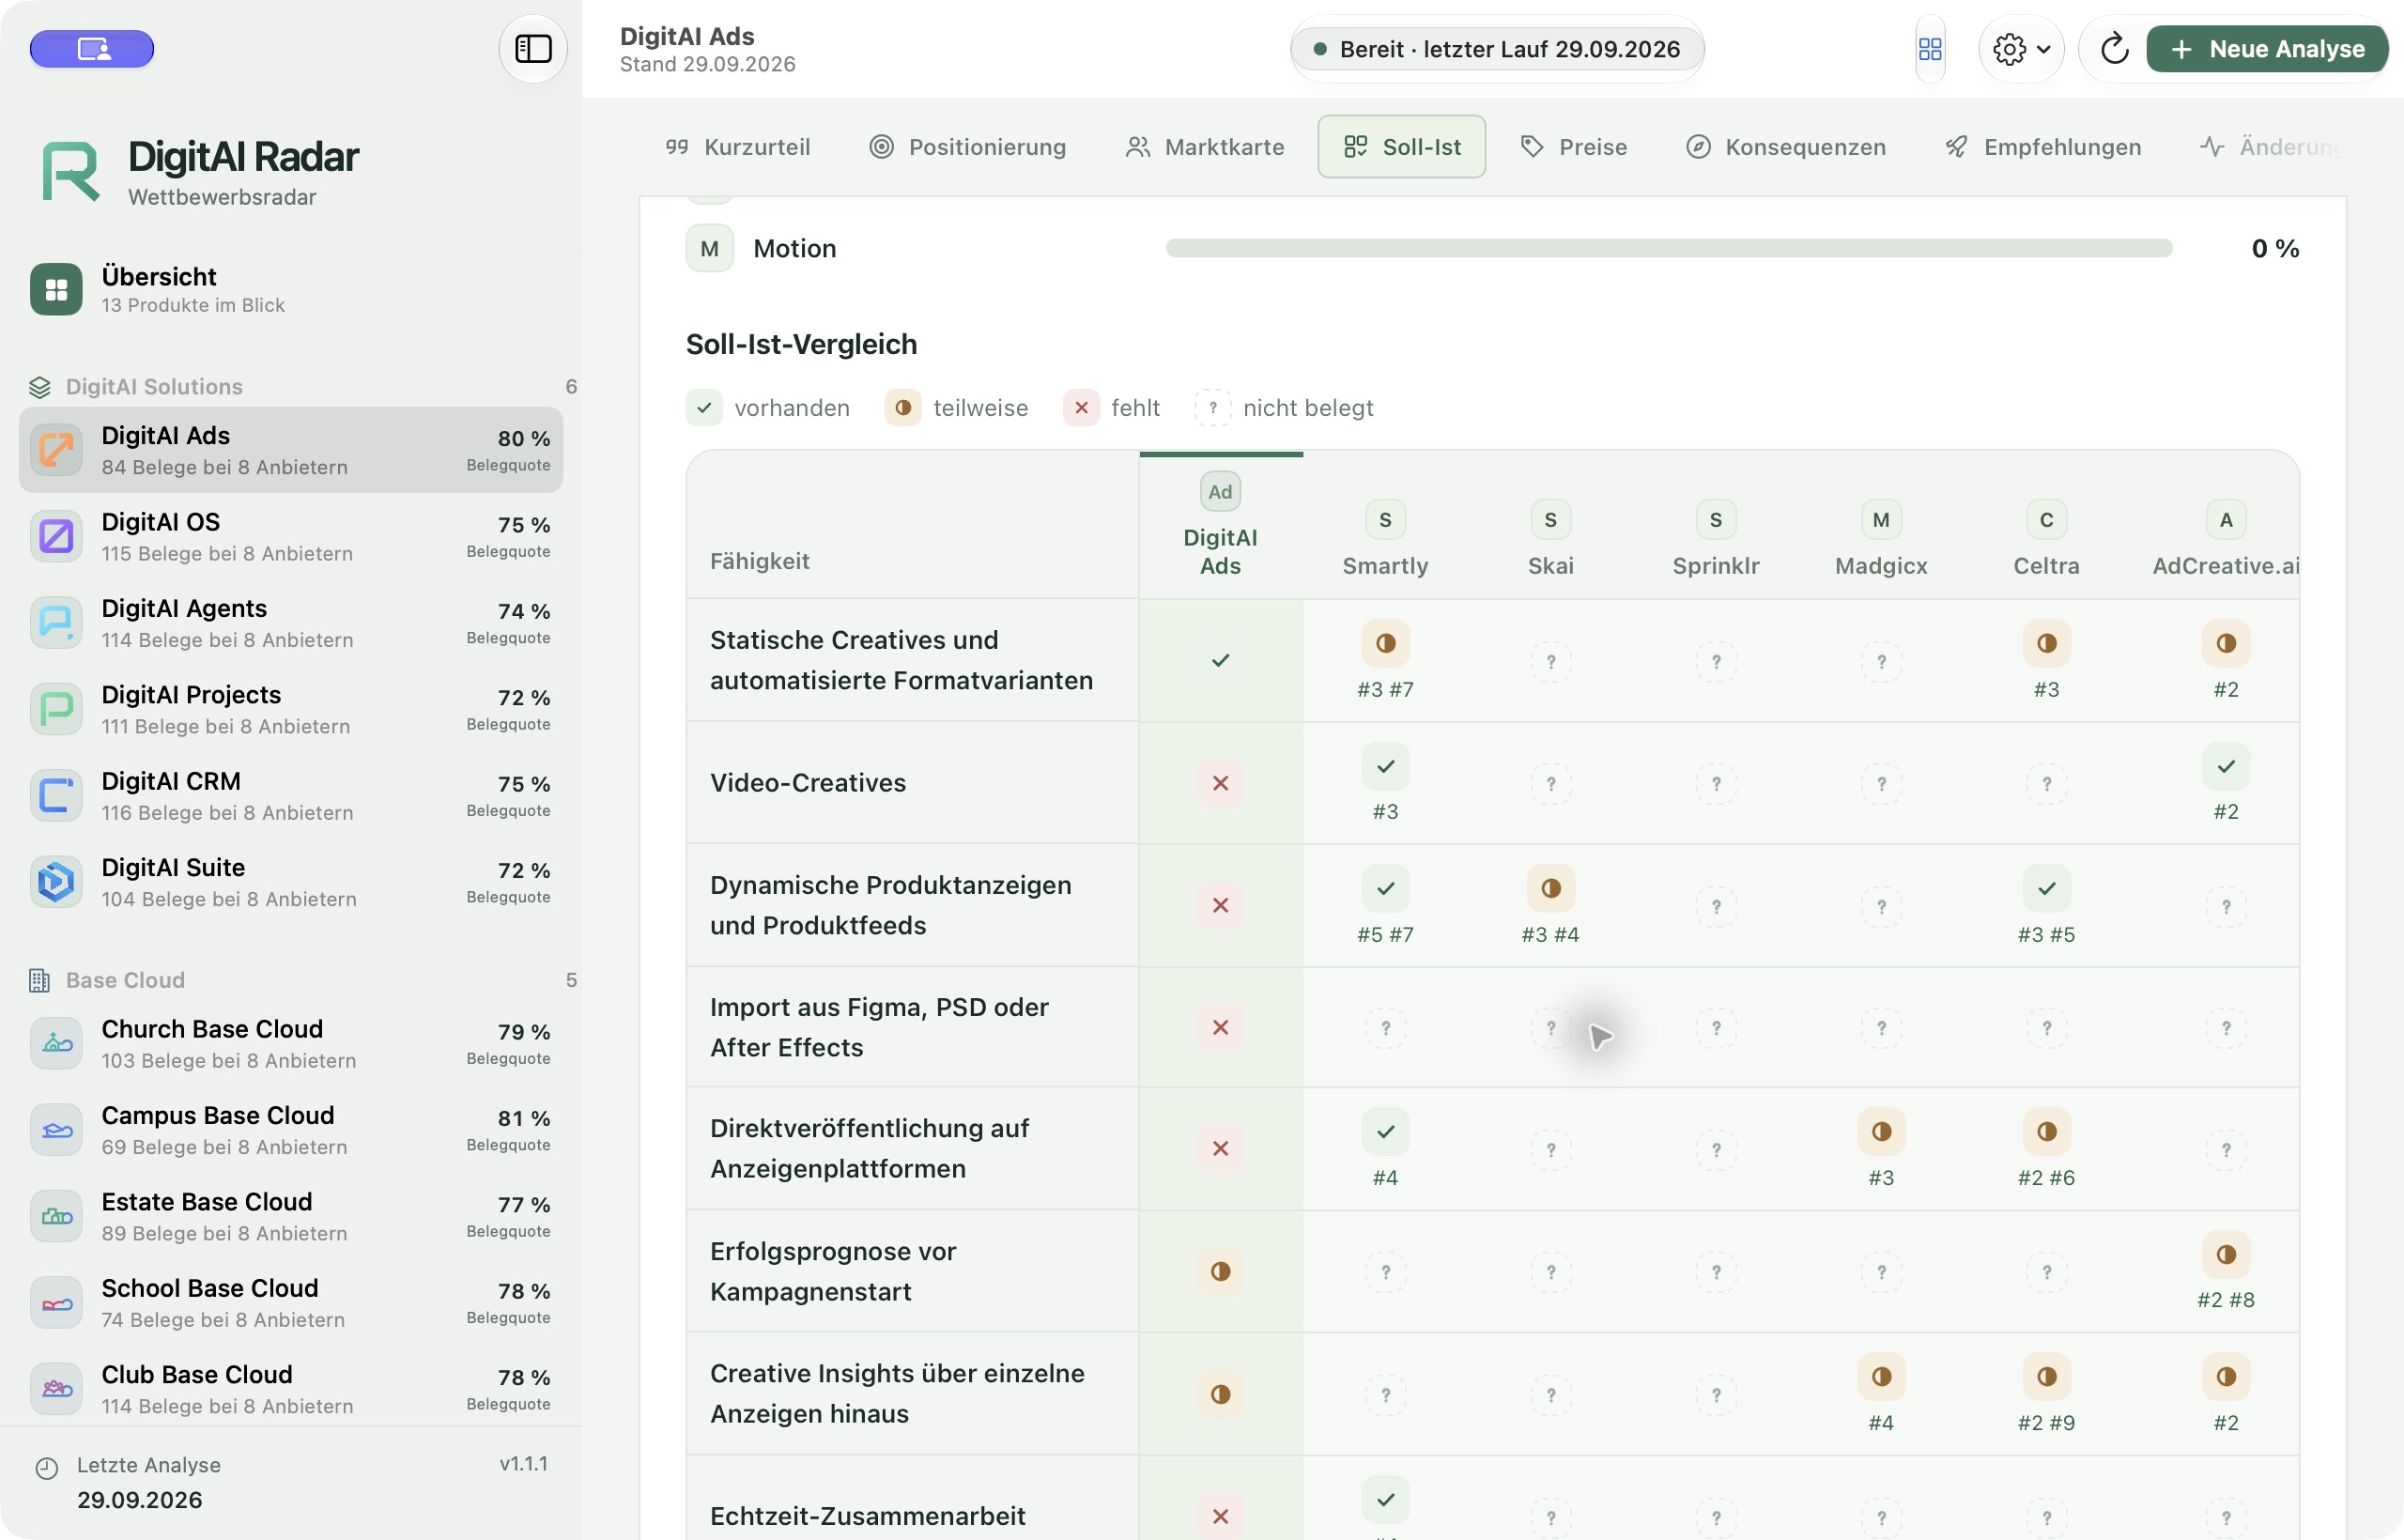
For each capability and provider, the matrix shows present, partial, missing or not evidenced. Source references sit alongside the entries. You can identify your own gaps and see where further research is needed.
Each competitor fact used in the analysis links to its evidence: statement, exact quote, source address and retrieval date. Read what supports an assessment and open the original page yourself.
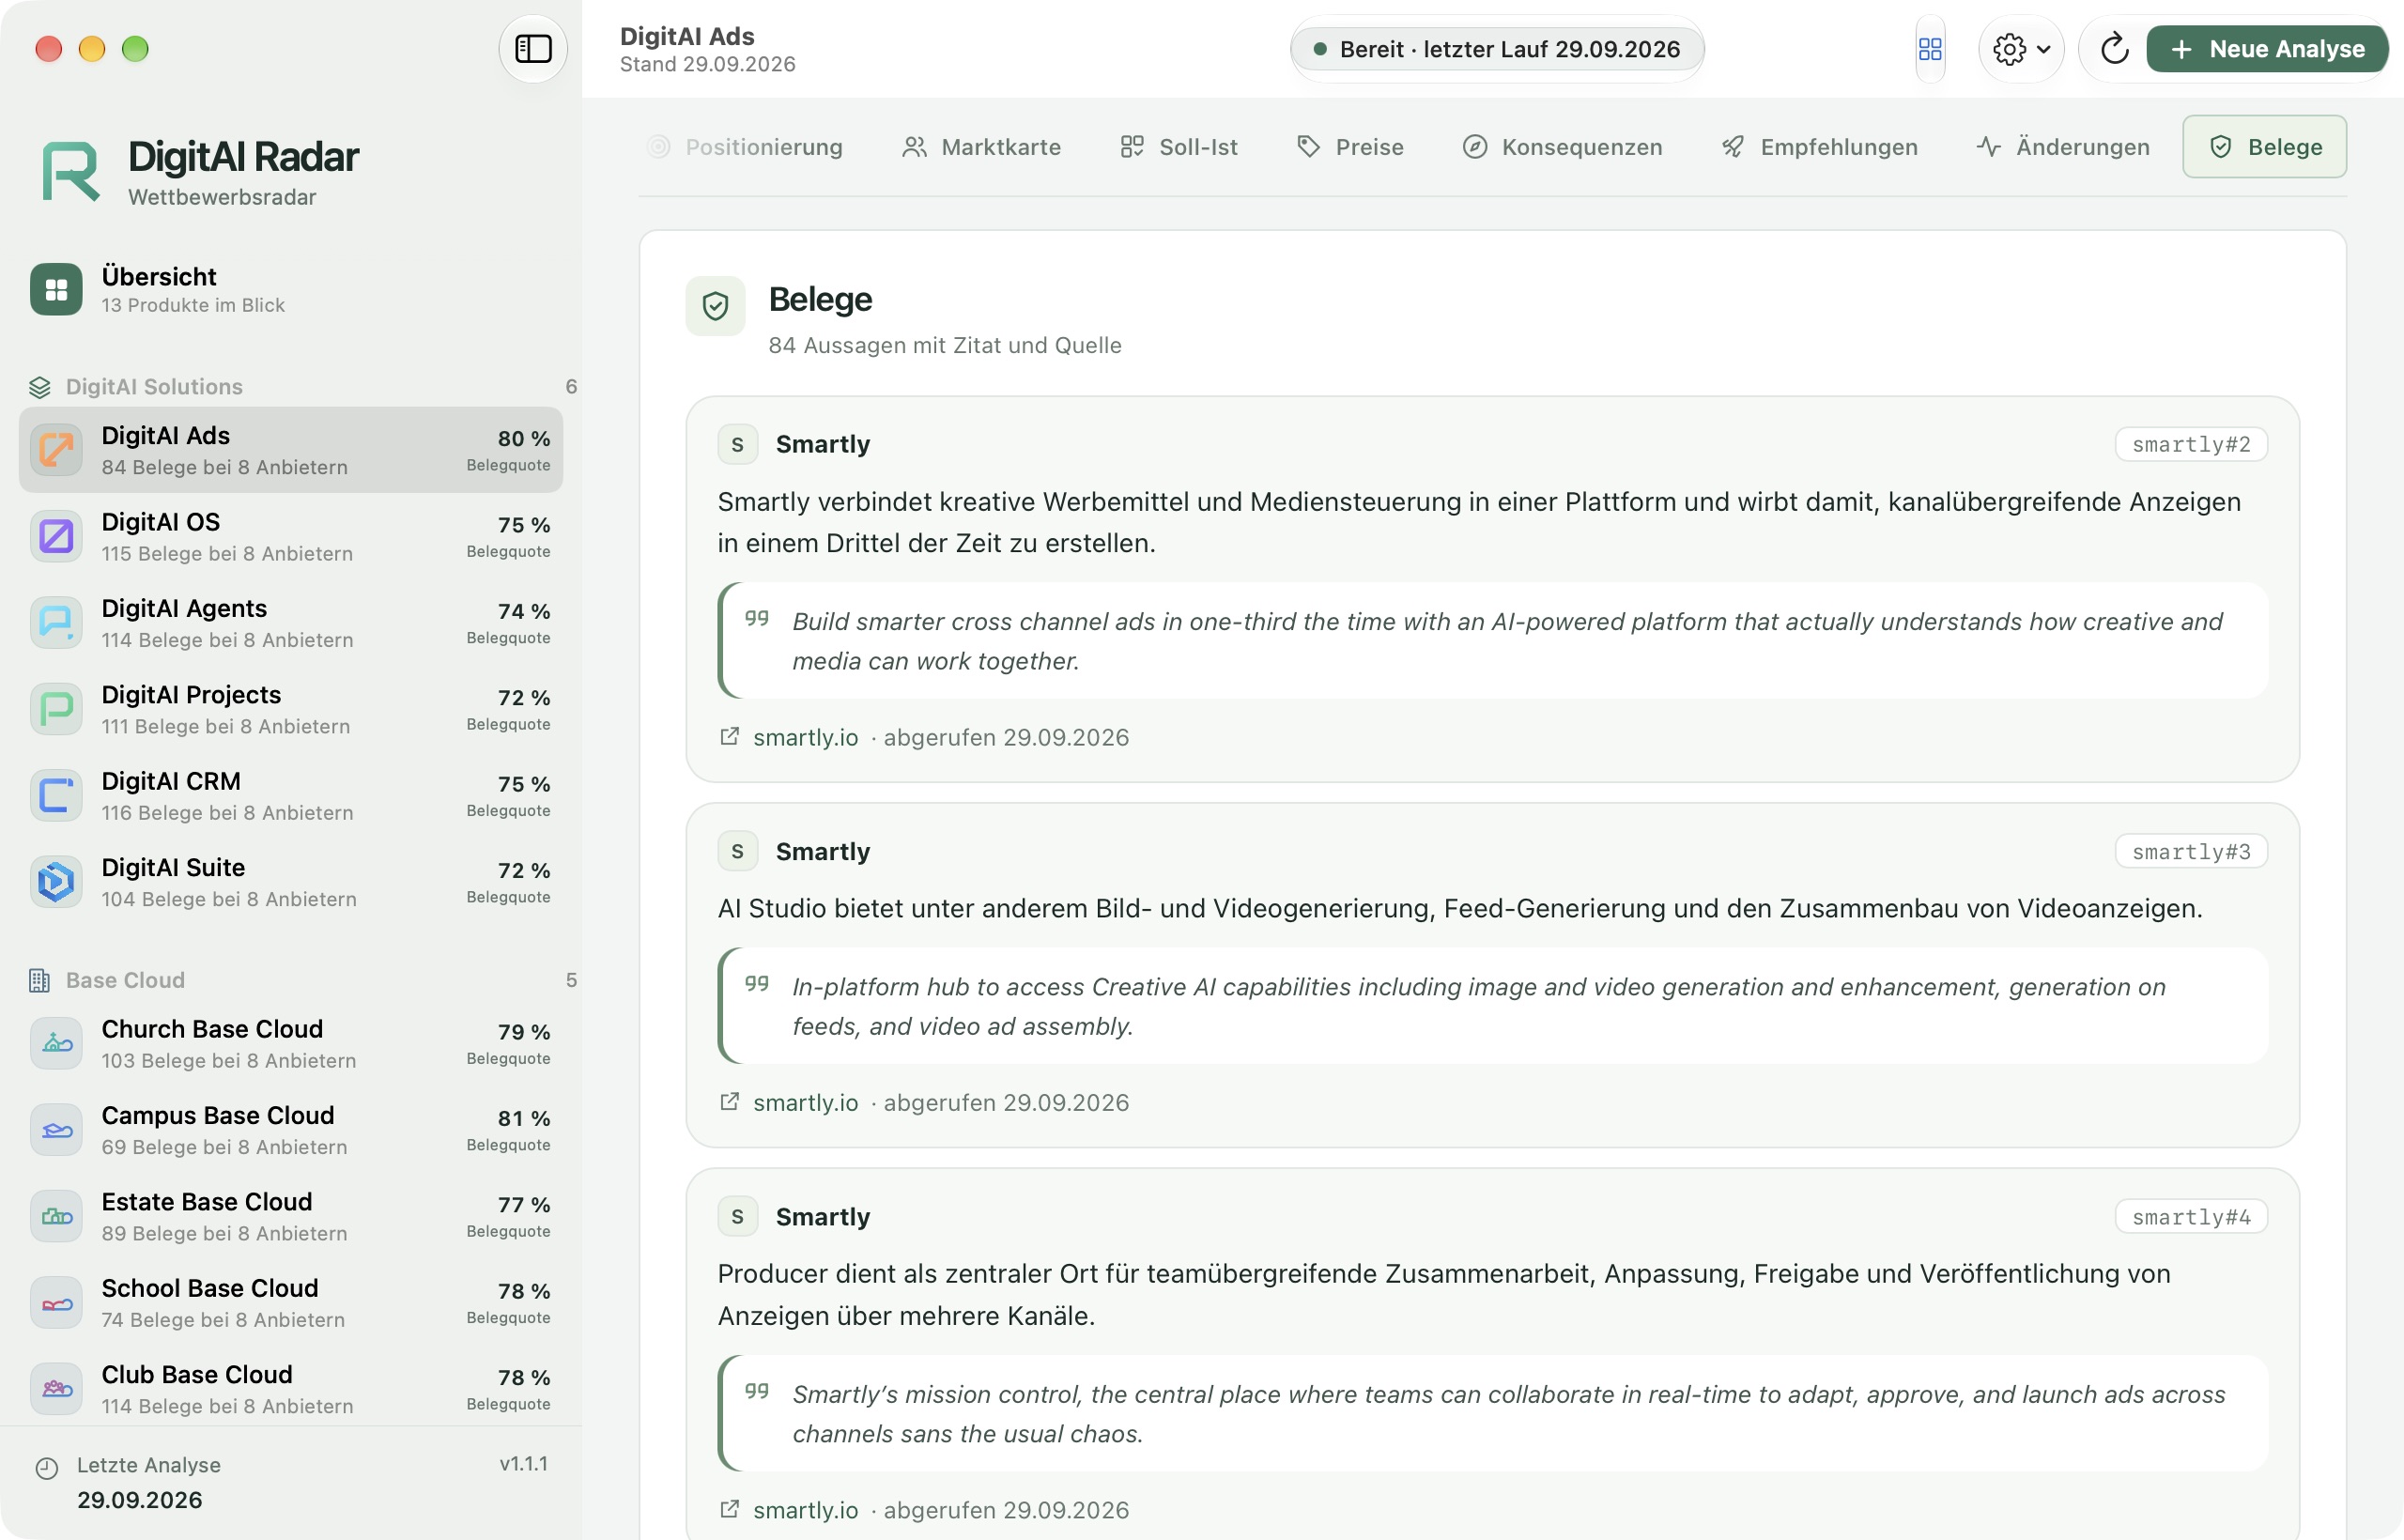
Original captures from DigitAI Radar 1.1.1. Analysis shown: 29 September 2026. The figures belong to this saved run.
Radar informs product and sales decisions. Once you decide, those findings can become concrete priorities in DigitAI Projects. Radar recommendations remain proposals; responsibility for planning stays with you.
Explore the suite productsIn the native Mac app or the protected web dashboard. The images on this page show our actual Mac app and our own product portfolio.
The interface can be switched to German, English and French. The saved analyses shown here are in German; source quotes remain in their original language.
Each analysis shows its date and the retrieval dates of its sources. New runs are started deliberately. The images on this page show the saved record from 29 September 2026.
We work with you to establish your products, markets and comparison questions. Scope, access, operations and ongoing analysis costs are agreed before use.
Which product, which competitors, which decision? Together we define a useful first analysis and show how Radar fits your work.
We agree source access and research scope before use. Inaccessible or unchecked material remains clearly identified; customer opinions do not establish product capabilities.
